lessons in this unit
in this lesson




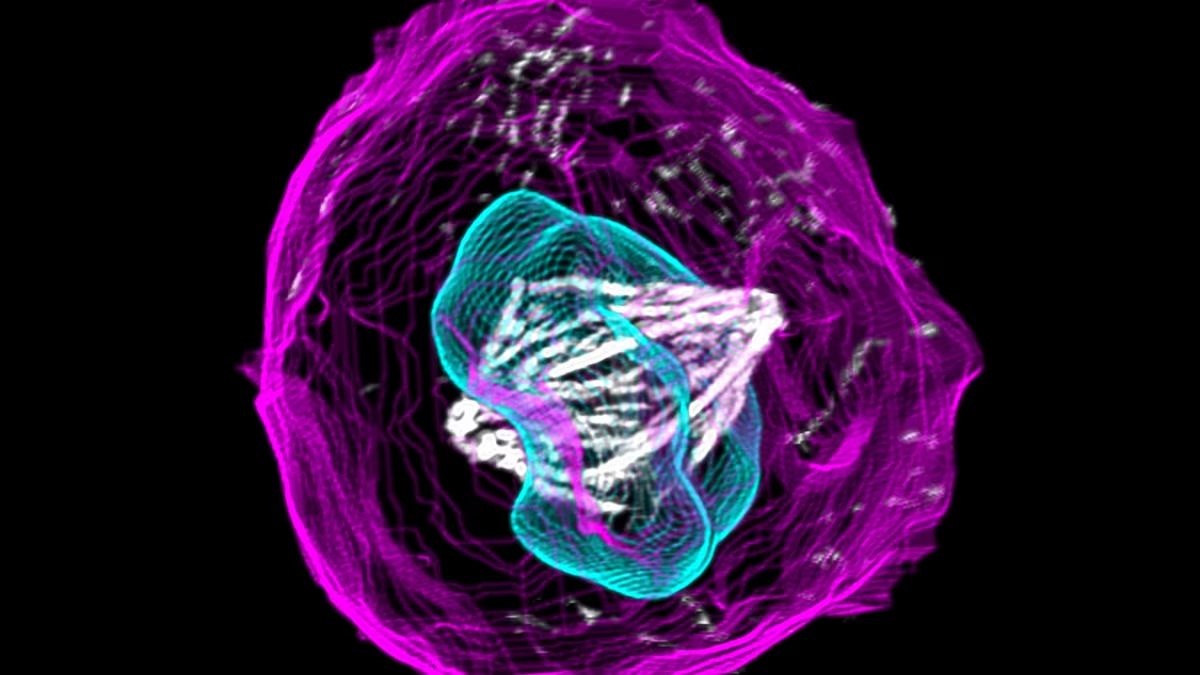
These materials were originally developed as two parallel modules covering related material on cell structures, cell division, and interpretation of microscopy data. The qualitative module asks what students observe from cell illustrations and microscopy images. The quantitative module also asks students to analyze pre-calculated and curated data from microscopy images. The modules are both organized in discrete sections that can be taught in the original sequence, used singly, or mixed between the two modules.
contents/
Qualitative module:
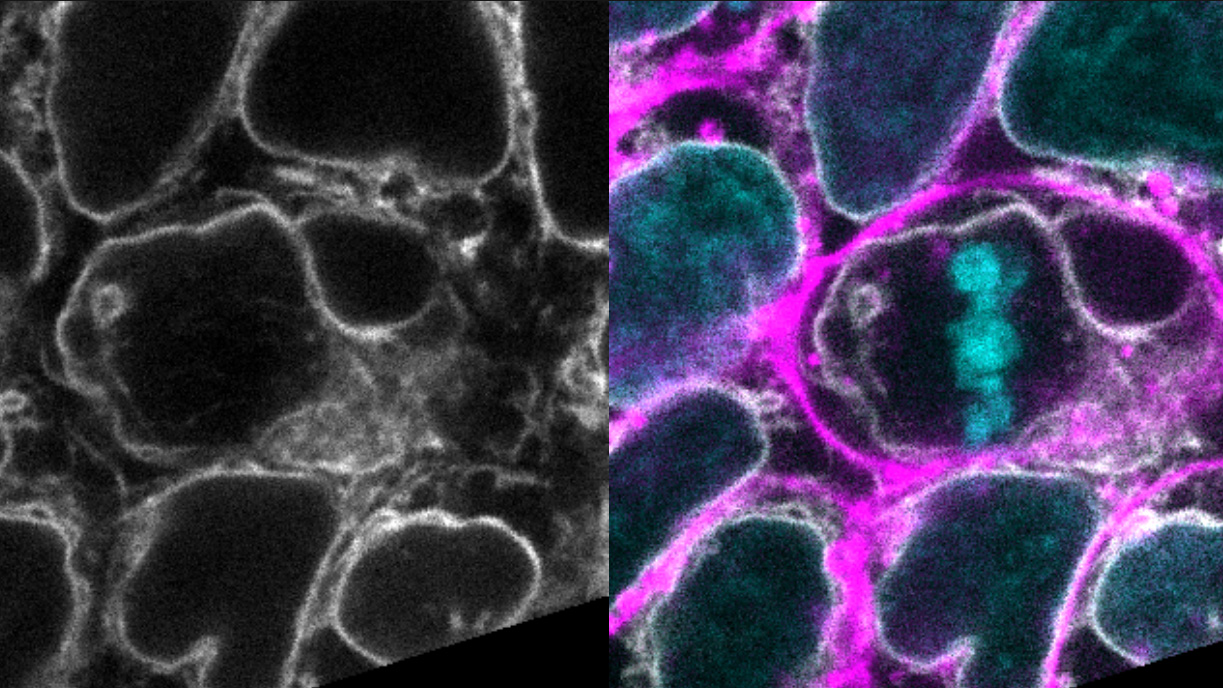
- An introduction to mitosis using real cell images
- Identifying mitotic stages in a large image dataset
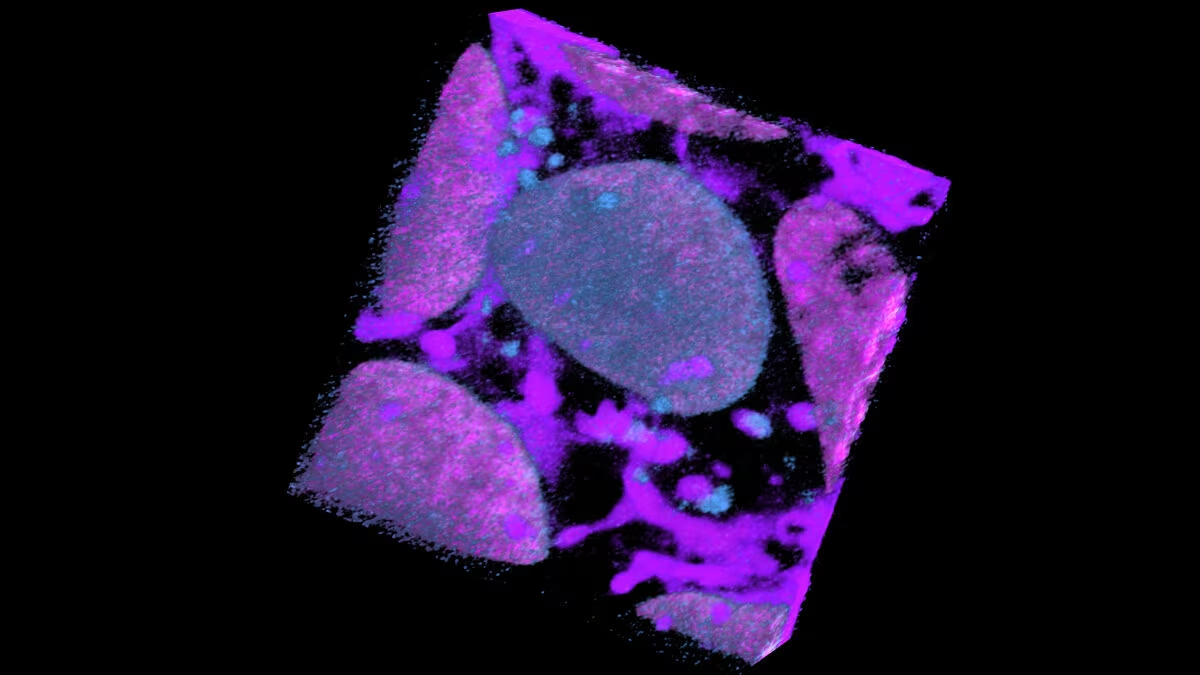
- Interactive 3D model of cell division
- Exploring organelle localization throughout mitosis
Quantitative module:
- An introduction to mitosis using real cell images
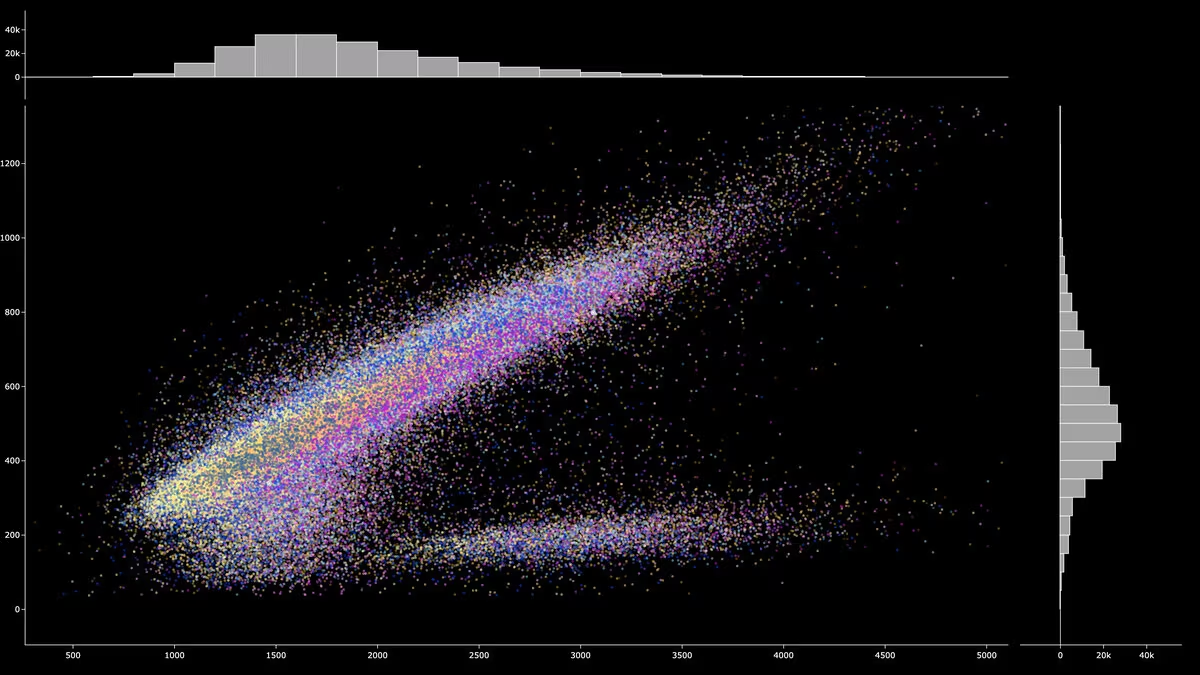
- Introduction to the Cell Feature Explorer (CFE)
- Quantitative analysis of stem cell images
learning objectives/
See individual sections for specific learning objectives. When taught in their original configuration, key learning objectives include:
Both modules:
- Summarize and illustrate the stages of mitosis, and how it fits into the larger cell cycle
- Evaluate mechanisms that help regulate the process of mitosis
- Apply key mitosis vocabulary such as chromosome, chromatin, and sister chromatids
- Evaluate and categorize real microscopy images based on which phase of mitosis they depict, and justify those categorizations
- Define human induced pluripotent stem cells (hiPSCs)
- Describe how fluorescent microscopy images are collected and processed at the Allen Institute
- Navigate and apply various open datasets and visualization software tools
Qualitative module:
- Describe how the Allen Institute’s 3D cell model illustrates the different stages of mitosis
- Explore and analyze how cell structures other than DNA or microtubules change throughout mitosis
- Compare your previous notions of human cells as depicted in textbooks to the 3D version modeled by the Allen Institute’s Visual Guide to Human Cells
- Synthesize information about organelle localization from Z-stack images
- Analyze the relative abundance of different cell structures within various parts of the cell
Quantitative module:
- Interpret scatterplots and bar graphs in terms of the relationship between an independent and dependent variable
- Create scatterplots in the Cell Feature Explorer and bar graphs in Excel to investigate the relationship between two variables
- Develop a question and hypothesis related to mitosis that can be investigated with the Cell Feature Explorer data
- Analyze data from the Cell Feature Explorer dataset to investigate a question related to mitosis
lessons in this unit
funding acknowledgement/
The development of this lesson was supported by the National Science Foundation under Award Number 2236366. The content is solely the responsibility of the authors and does not necessarily represent the official views of the National Science Foundation.