This is some text inside of a div block.
in this lesson
table of contents will display on published page only
set h2 to populate the table of contents here


About this lesson:
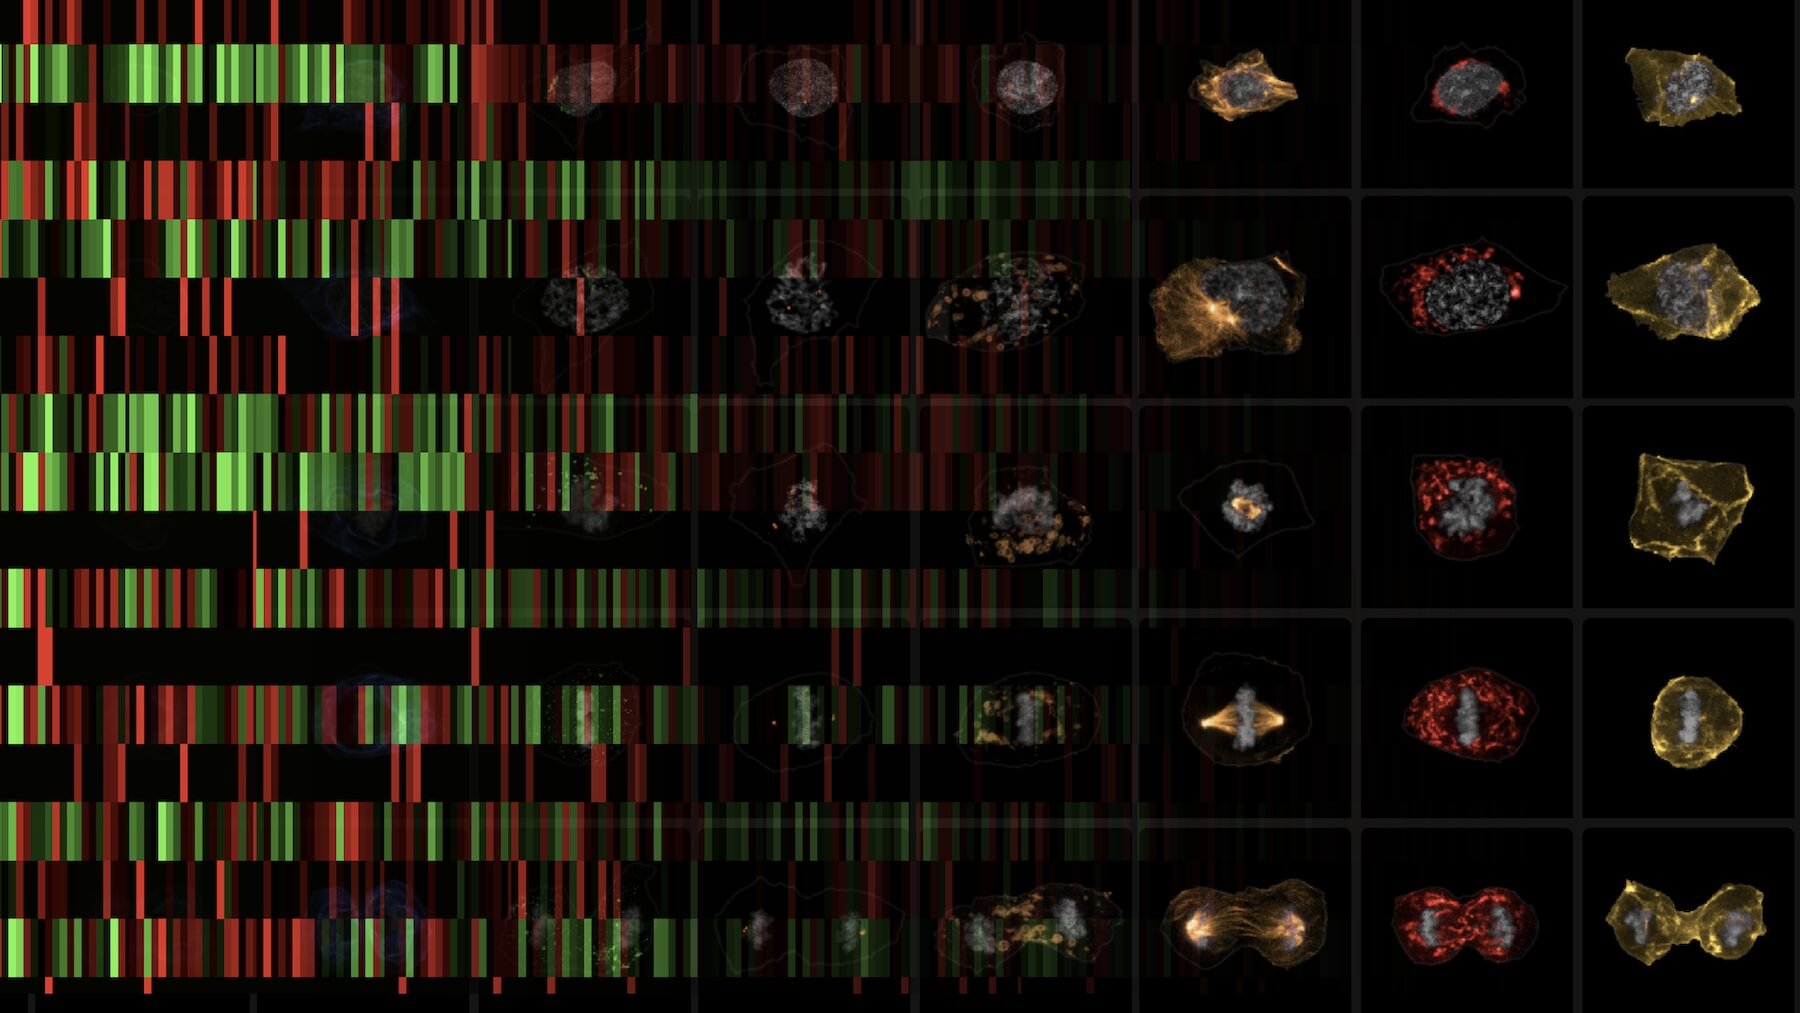
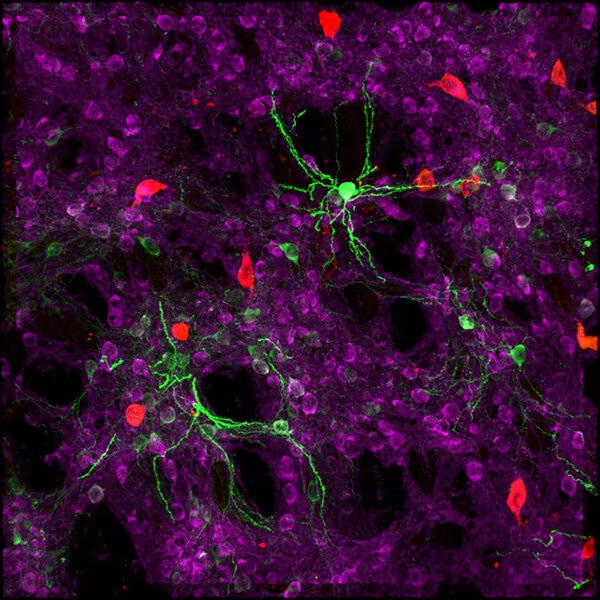
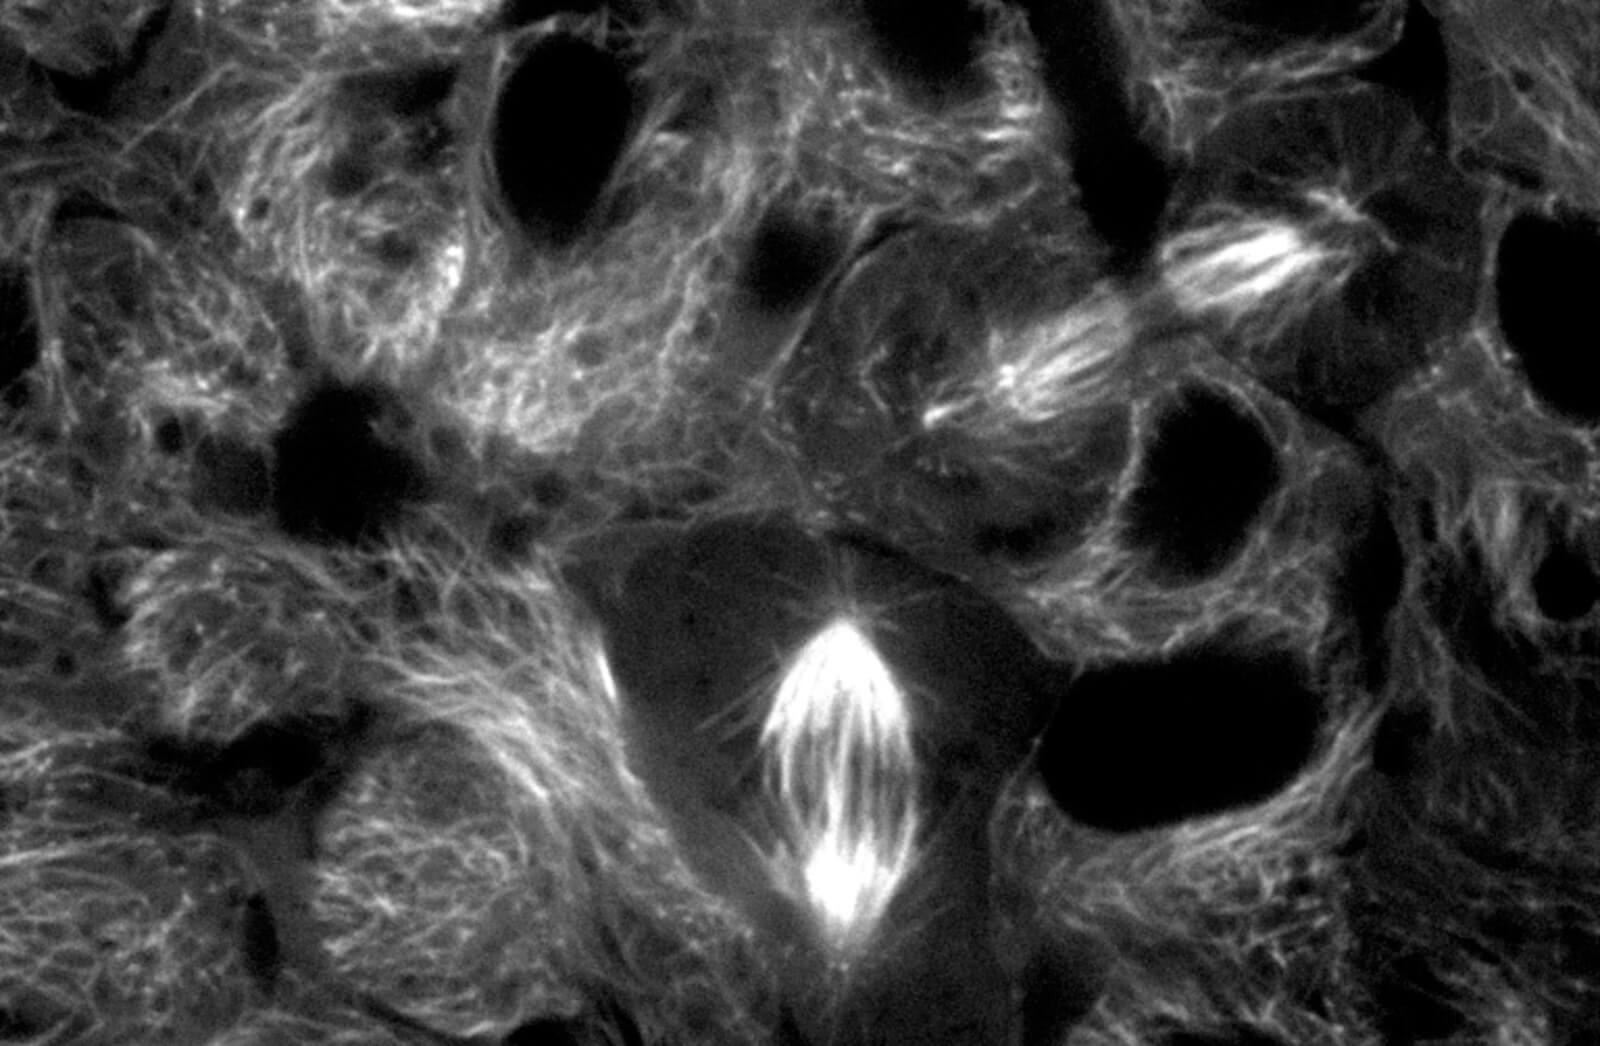
This lesson guides students through an exploration of a large dataset of human cell images with fluorescently tagged structures. Through this two-part activity, students are asked to generate a hypothesis and prediction related to the amount of time it takes a cell to complete each stage of cell division. Then, students explore the dataset and count the number of cells in each stage of mitosis, entering their data into a spreadsheet for later analysis. The CourseSource article features a teaching discussion where the authors comment on their experience teaching with the lesson and potential variations that other instructors could try.
Materials
All materials are available in the “Article Files” section of the CourseSource publication.
- CourseSource article
- Slides
- Student handout
- Example grading rubric
- Instructor webinar