lessons in this unit
in this lesson


.jpg)


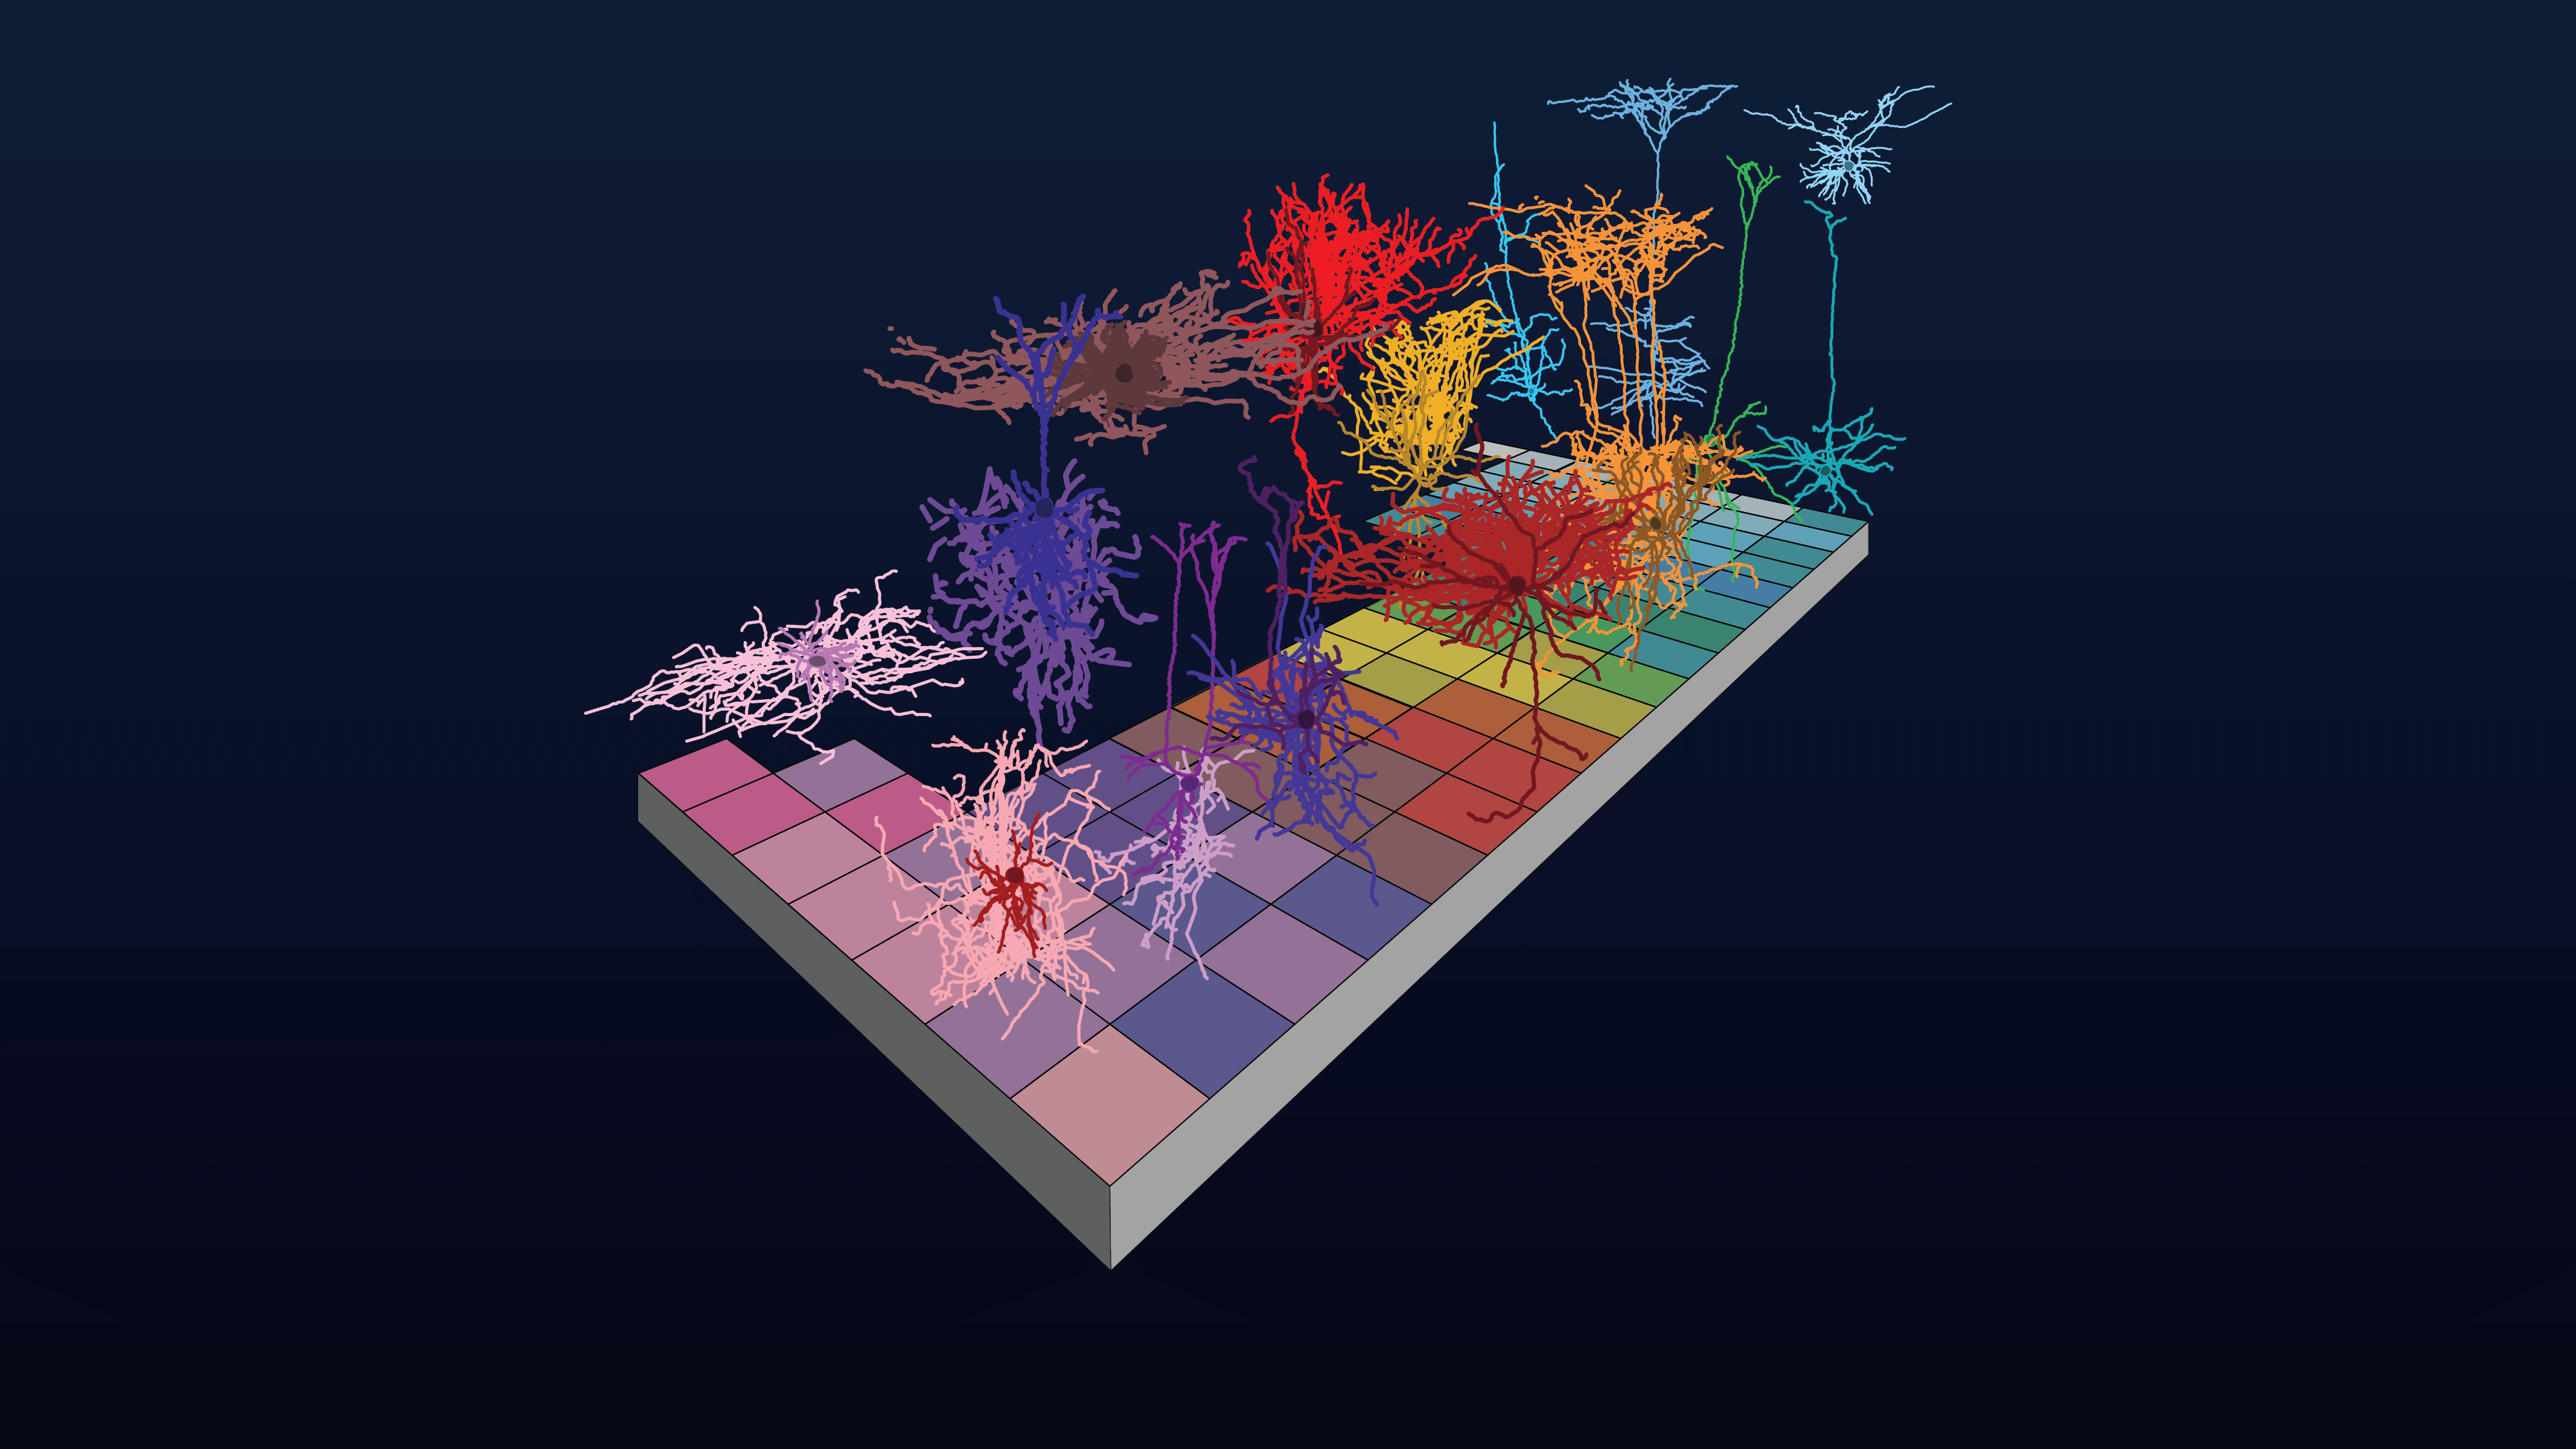
What is Patch-seq?
Patch-seq is a technique used to gather multiple types of data from a single neuron within a sample of living tissue. This method builds upon the Nobel-prize winning work of Erwin Neher & Bert Sakmann in the 1970s who developed the patch-clamp technique to measure the electrical signaling of individual neurons. By combining that electrophysiology data with the collection of morphology and gene expression data, neurons can be characterized and classified into cell types that may have similar functions in the brain.
Patch-seq lab tour
Curious about how scientists study the cells of the brain? Watch this video for a behind-the-scenes look at the Allen Institute’s patch-seq research pipeline and meet our teams of scientists working together to gather data on morphology, electrophysiology, and gene expression—all from the same neuron. The data collected through this pipeline are freely available for you to explore at brain-map.org. Video length: 9:48
Collecting data with patch-seq
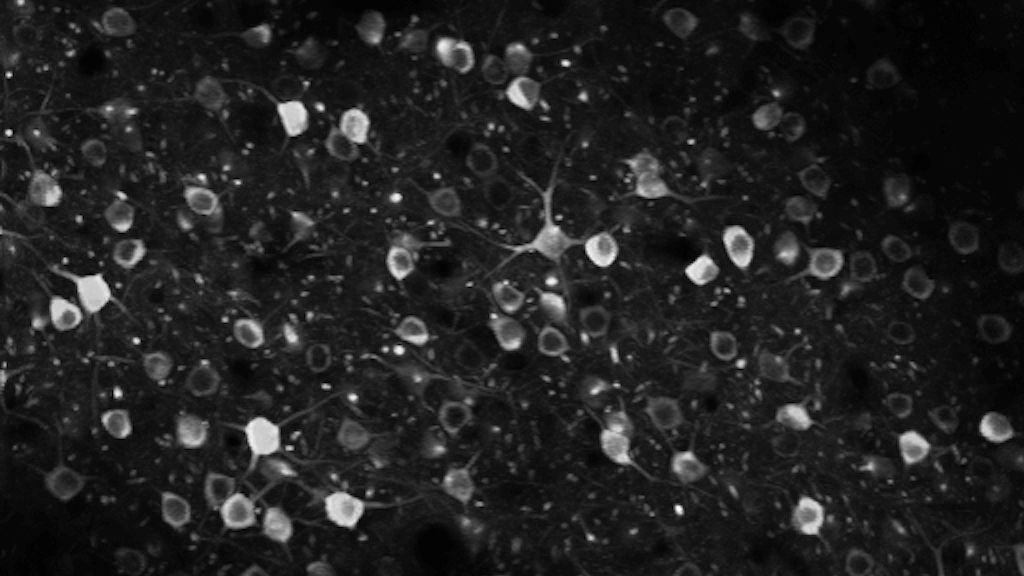
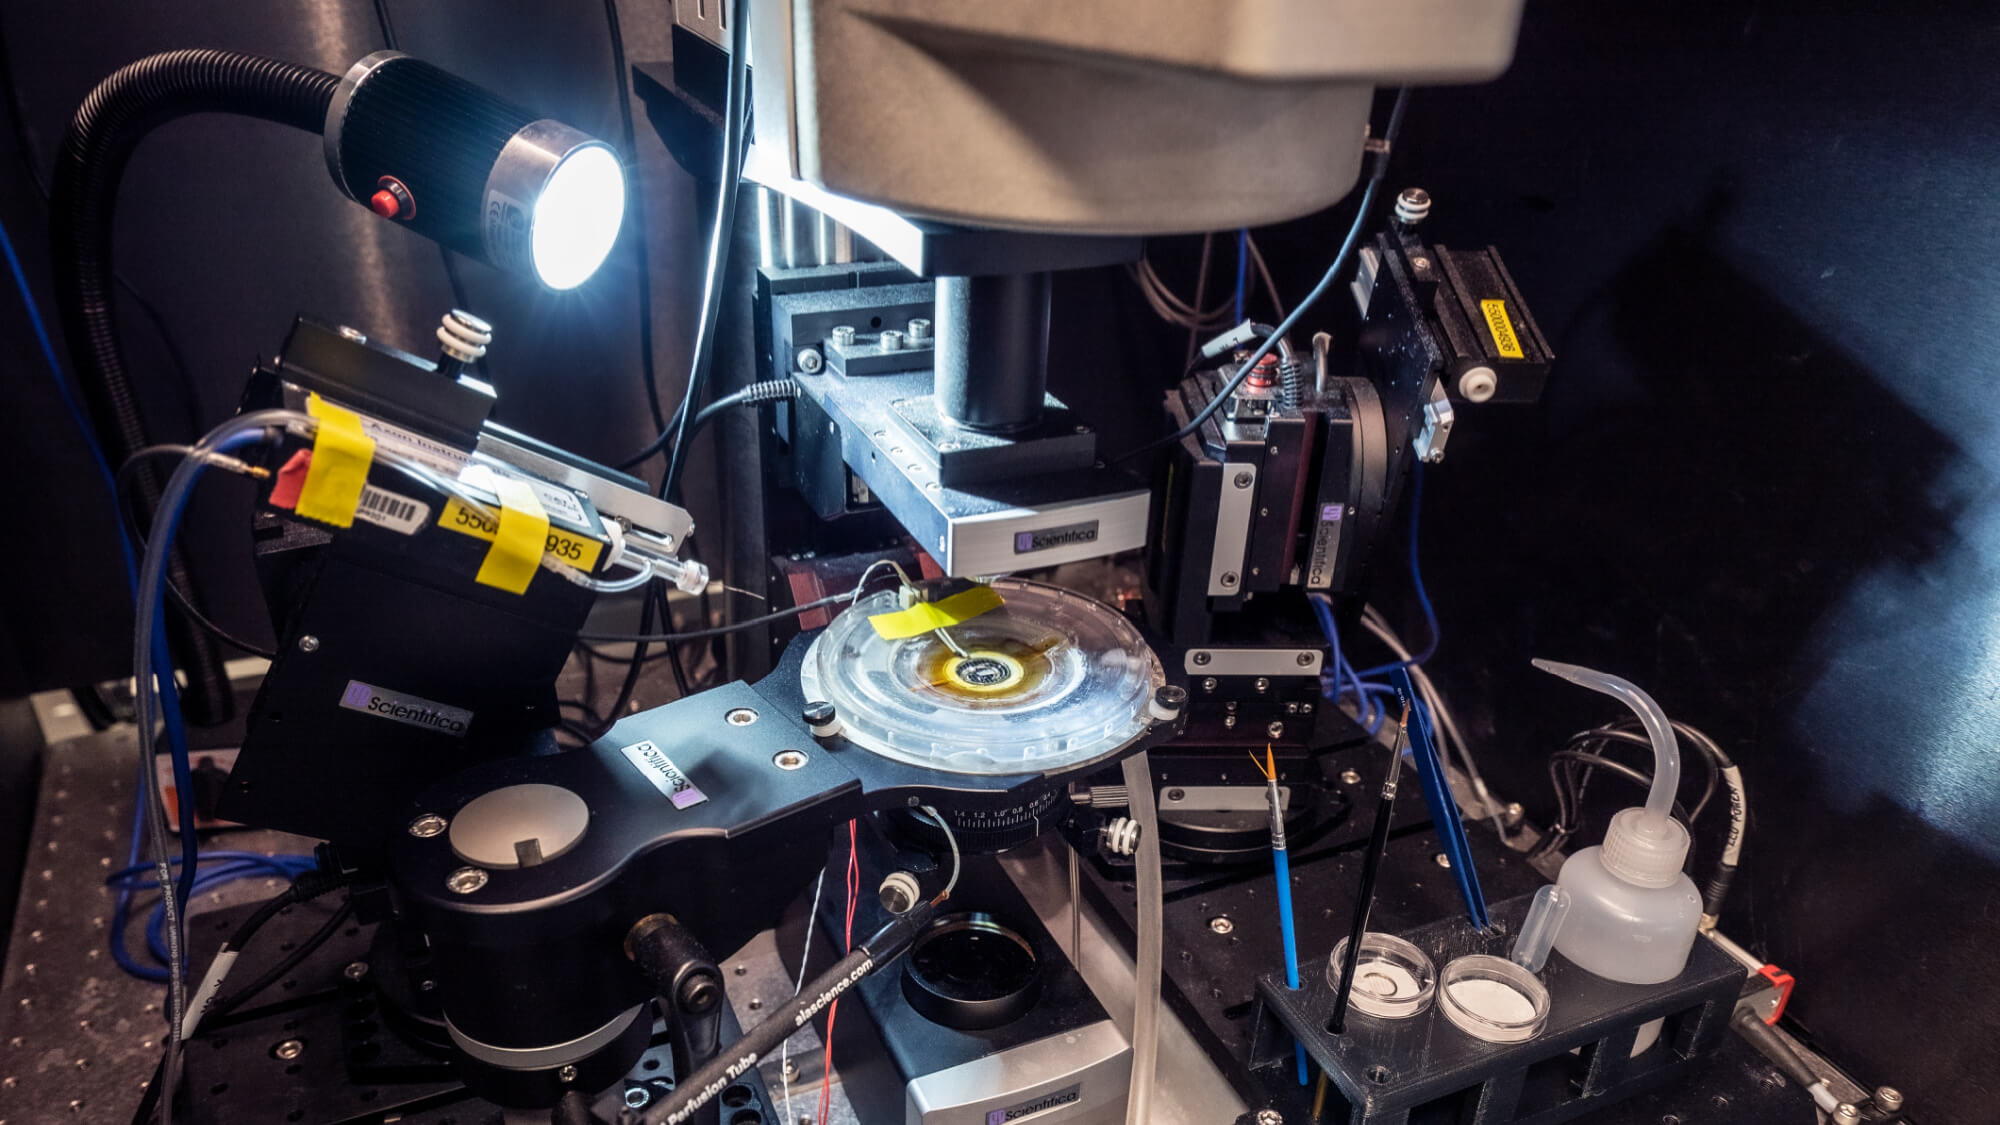
Measuring electrophysiology: Patch-clamping refers to the use of a small glass pipette containing an electrode, lowered under a microscope to touch the surface of a living neuron. By applying a small amount of negative pressure, scientists are able to carefully rupture the membrane of the cell and gain access to record its responses to electrical stimulation.
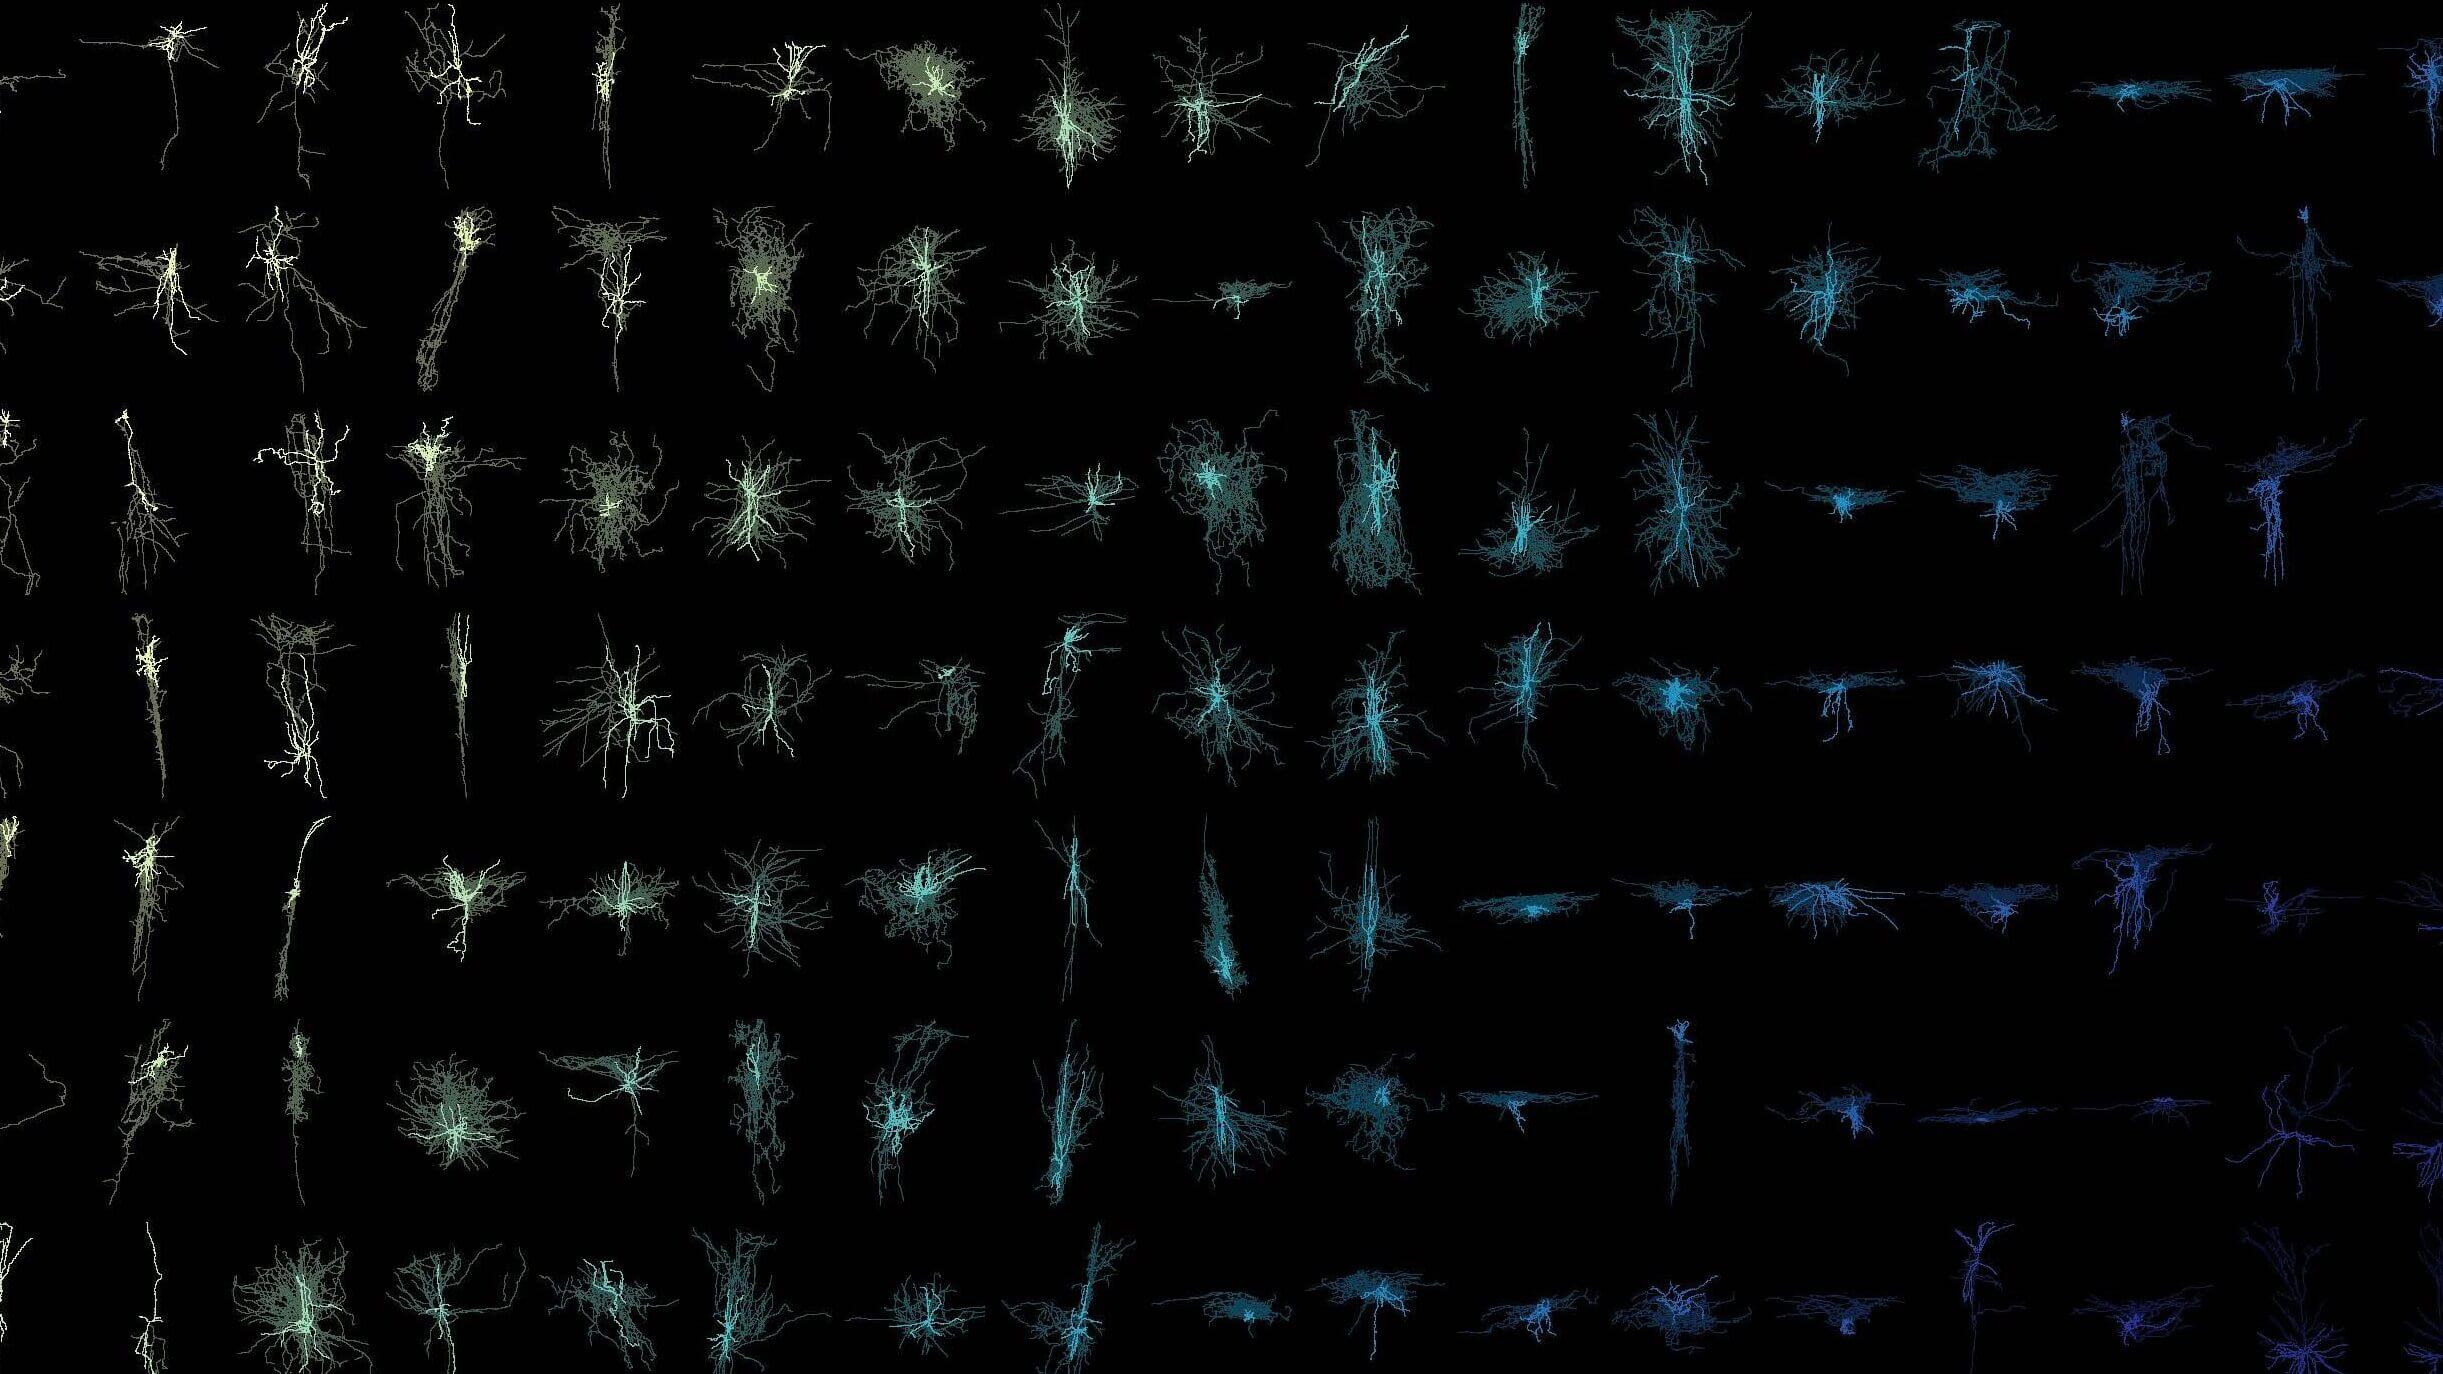
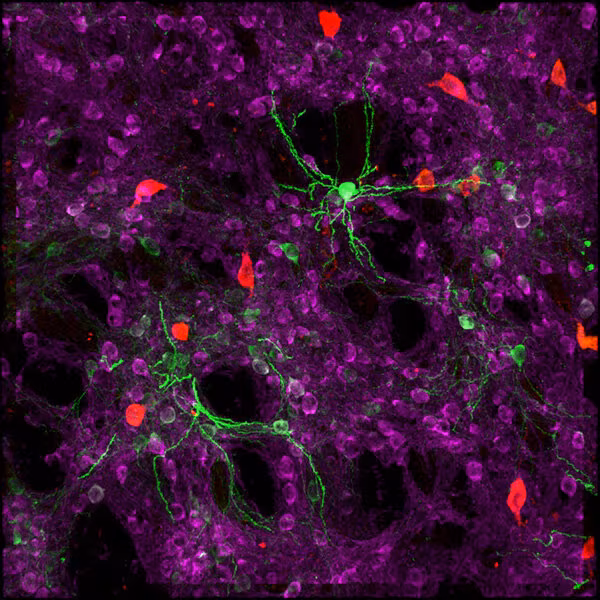
Measuring morphology: In addition to recording electrical activity, the glass pipette is used to fill the neuron with a dye, called biocytin, which enables later imaging to visualize the detailed morphology (shape) of the cell. After that imaging, the three-dimensional structure of the neuron can be reconstructed using computer software to allow quantification of properties such as axon length, number of dendrites, and more.
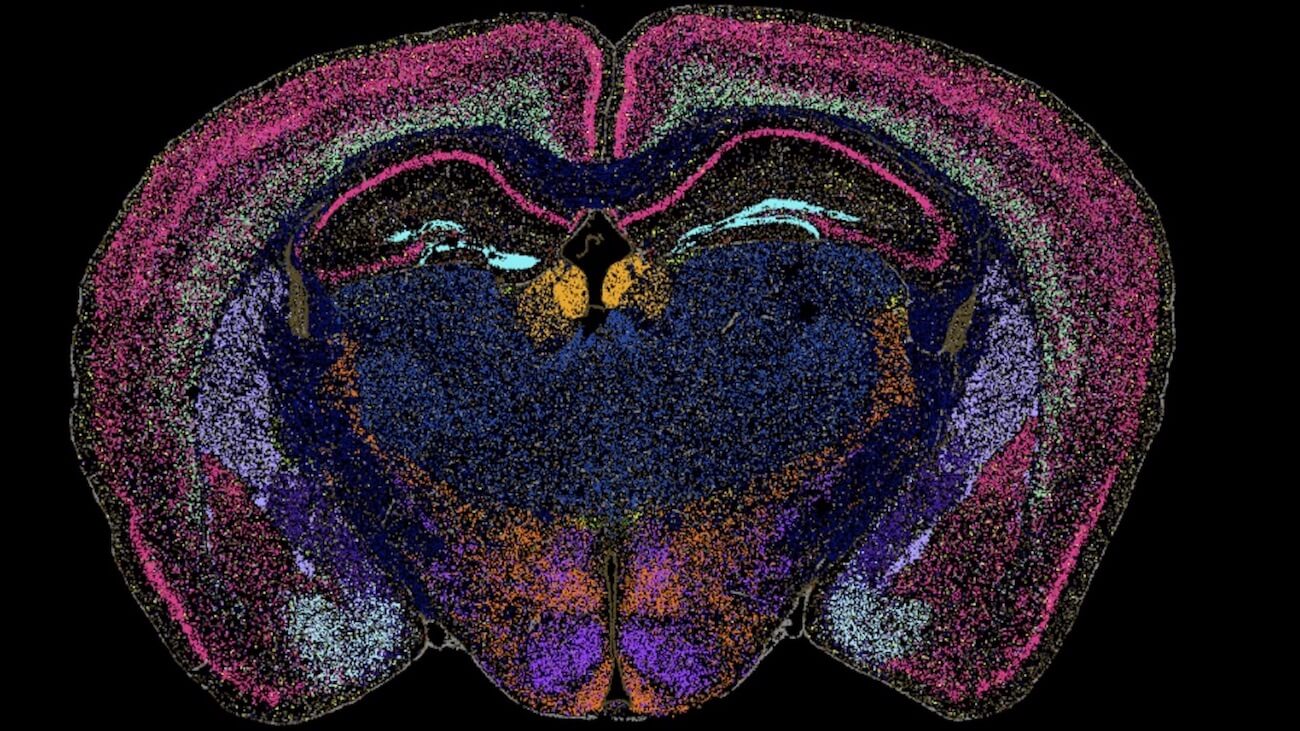
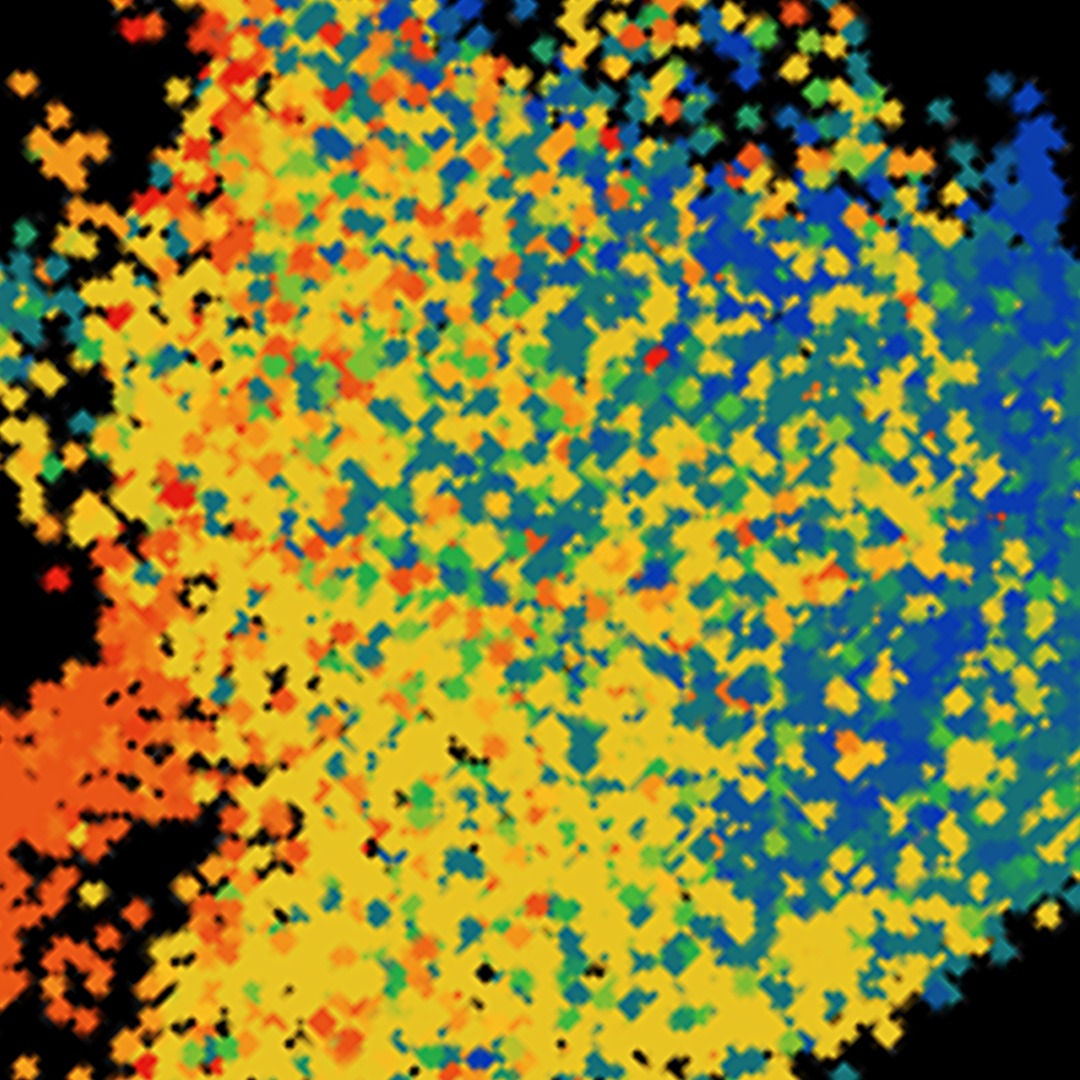
Measuring gene expression (transcriptomics): After the cell’s electrical activity has been measured and biocytin dye has been added, scientists then extract the nucleus of the cell using the same glass pipette. This allows the RNA inside to be sequenced, providing insight into which genes were being expressed within the cell at that moment in time. The resulting transcriptomic data, combined with the electrophysiology and morphology data, makes Patch-seq a powerful multimodal technique for describing individual neurons.